import torch
import matplotlib.pyplot as plt
# 1. 데이터 생성
xs = torch.linspace(-5, 5, 100) # 100개의 x 값
noise = torch.randn(len(xs)) # 노이즈 생성
ys = xs + noise # 타깃 값 (노이즈가 섞인 직선)
# 2. 상수항 추가 (X를 [1, xs] 형태로 변환)
X = torch.stack([torch.ones(len(xs)), xs], dim=1) # 100x2 행렬 (1열은 상수항, 2열은 특징 xs)
# 3. 정규 방정식 적용 (θ = (X^T X)^(-1) X^T y)
theta = torch.inverse(X.T @ X) @ X.T @ ys
# 4. 결과 출력
print(f'최적의 파라미터 (θ): {theta}')
# 5. 예측값 계산
ys_pred = X @ theta # 예측 값
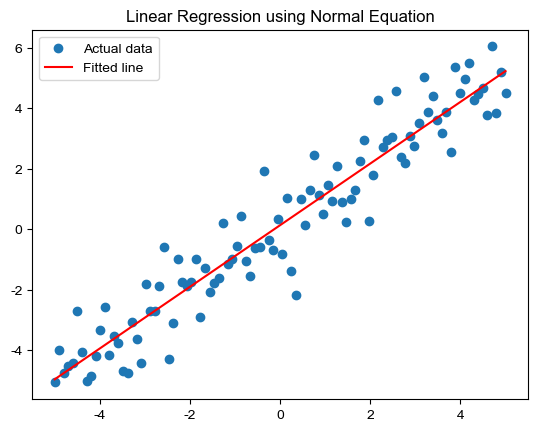
# 6. 실제 값과 예측 값 시각화
plt.scatter(xs, ys, label='Actual data') # 실제 데이터
plt.plot(xs, ys_pred, color='red', label='Fitted line') # 예측된 직선
plt.legend()
plt.title("Linear Regression using Normal Equation")
plt.show()